A complete guide to read Mention Network brand report
A section-by-section walkthrough of the Mention Network brand report: visibility, share of voice, citations, topics, and geography, plus how to act on each metric.

When someone asks ChatGPT or Gemini for a recommendation, does your brand come up? Does the answer name your products? The Mention Network AI Visibility Report answers both. It measures how your brand and your products show up across the major AI assistants, built on 284,699 AI-generated answers, 23,725 prompts, and 1,303,946 citations across 6 LLMs (data updated October 9, 2025).
The report reads how AI responds when people ask for recommendations, comparisons, and where to buy. Then it goes further: a store audit that explains why AI isn't picking you, and fixes you can push to your product pages. Here's how to read each section and act on it.
Key Takeaways:
- The report measures your visibility across six AI platforms: Grok, ChatGPT, Deepseek, Perplexity, Google, and Gemini.
- Rankings compare you against thousands of competitors using actual AI responses.
- Topic analysis shows which categories you own and where competitors beat you.
- Citation metrics show whether AI models trust your content enough to cite it.
- Geographic data maps your strength across 132 countries and flags expansion room.
What you'll learn:
- Overview section
- Using the AI insights and SWOT analysis
- Reading your brand visibility metrics
- Understanding share of voice data
- Navigating topic performance analysis
- Reading prompt-level performance data
- Interpreting citation metrics
- Analyzing geographic distribution data
Overview section
The Overview dashboard is where you start. Four metrics, one screen, the executive summary before you dig into the detail.
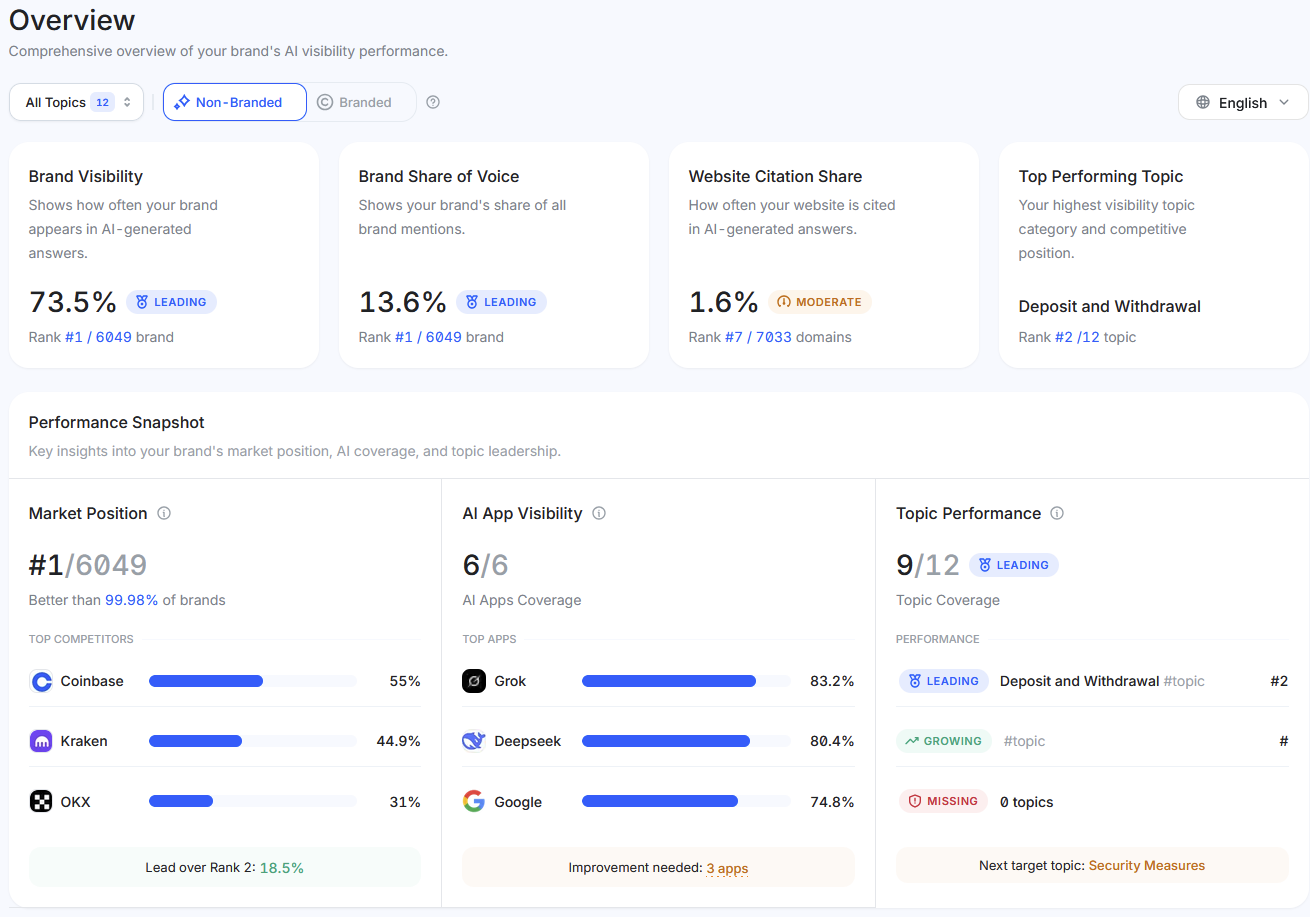
Overview dashboard.
Brand Visibility is how often your brand shows up in AI answers across every tracked topic. Think of it as your share of appearances. If you see 73.7% with a "LEADING" badge and rank #1 out of 6,234 brands, you're turning up in roughly three of every four AI conversations about your industry, measured against every competitor tracked in your space.
Brand Share of Voice measures your slice of total brand mentions. Visibility tells you how often you appear; share of voice tells you how much of the conversation you own. A 13.6% share means Binance accounts for about one-seventh of all brand mentions in its industry's AI discussions. The rank here is about mention volume, not appearance frequency.
Website Citation Share reveals how often AI models cite your website as a source. A reading like 1.6% at rank #7 out of 7,033 domains tells you whether AI treats your content as authoritative. High visibility with low citation share is a specific signal: AI knows about Binance but doesn't lean on its content as a primary source.
Top Performing Topic points to the category driving your best visibility. In the example, "Deposit and Withdrawal" at rank #2 out of 12 topics is a clear strength with one rung left to climb.
Below that, the Performance Snapshot previews three dimensions you'll open up later. Market Position (#1/6234, better than 99.98% of brands) frames your overall standing. AI App Visibility (6/6 AI apps covered) shows how many of the six tracked platforms mention you. Topic Performance (9/12 LEADING) counts the categories you're winning.
Using the AI insights and SWOT analysis
The AI Insights section pulls data from across the report into a SWOT frame, strengths, weaknesses, opportunities, and threats, with recommendations attached.
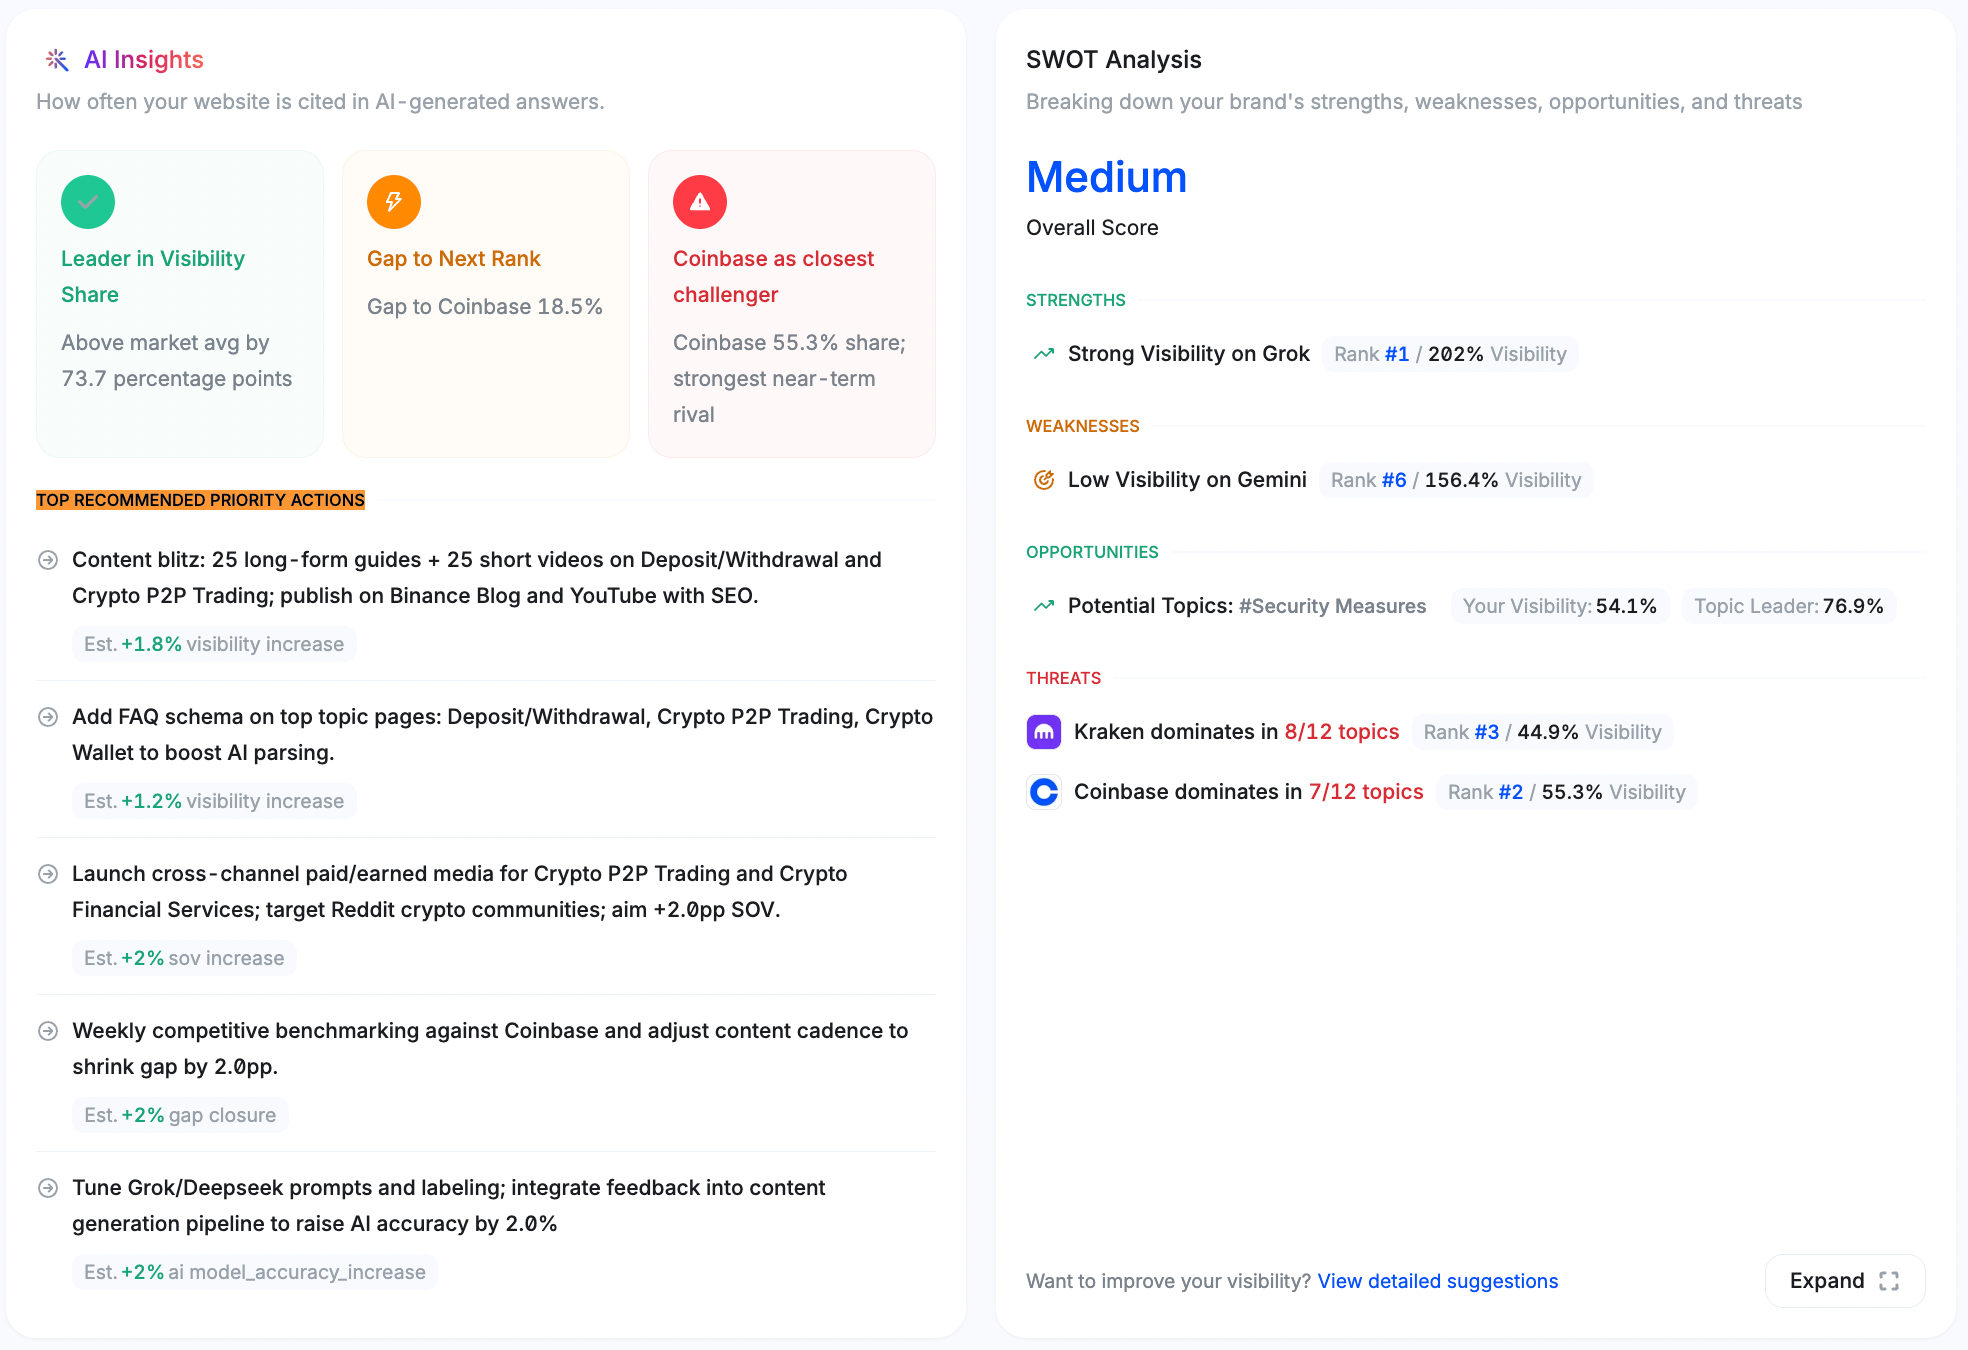
AI Insights and SWOT Analysis.
How to read the SWOT quadrants:
Strengths show what's working. You'll see lines like "Market leadership in visibility - Rank 1 of 6234 with 73.7% visibility" confirming you're on top, or "Strong Visibility on Grok - Rank #1 / 202% Visibility" telling you which platforms favor you most.
Weaknesses flag the gaps. A pattern like "Low Visibility on Perplexity - Rank #6 / 156.3% Visibility" means you're underperforming on that platform relative to your overall #1 position. "Gap to #2 [Competitor]" lines put a number on where you're exposed.
Opportunities point to where focused effort pays off. "Potential Topics: #Security Measures - Your Visibility: 54.1%, Topic Leader: 76.9%" marks a category where you could close a 22.8-point gap with targeted content.
Threats name the competitors gaining ground. "Kraken dominates in 8/12 topics - Rank #3 / 44.9% Visibility" tells you a rival has broad strength across categories, so you know who to watch.
💡Read more: How AI Visibility Data Flows Through Mention Network to Build Smarter Brands
Top recommended priority actions
This part turns insight into a task list. Each recommendation names the action ("Launch Coinbase comparison campaign on Binance blog and YouTube"), the target ("weekly SOV tracking"), and the expected impact ("Est. +4.9% SOV gap reduction"). Start with the highest-impact actions that fit your goals. They're pulled from your performance gaps and competitive position across every metric.
Reading your brand visibility metrics
The Brand Visibility section digs into how often and where your brand appears in AI answers. Three parts to read.
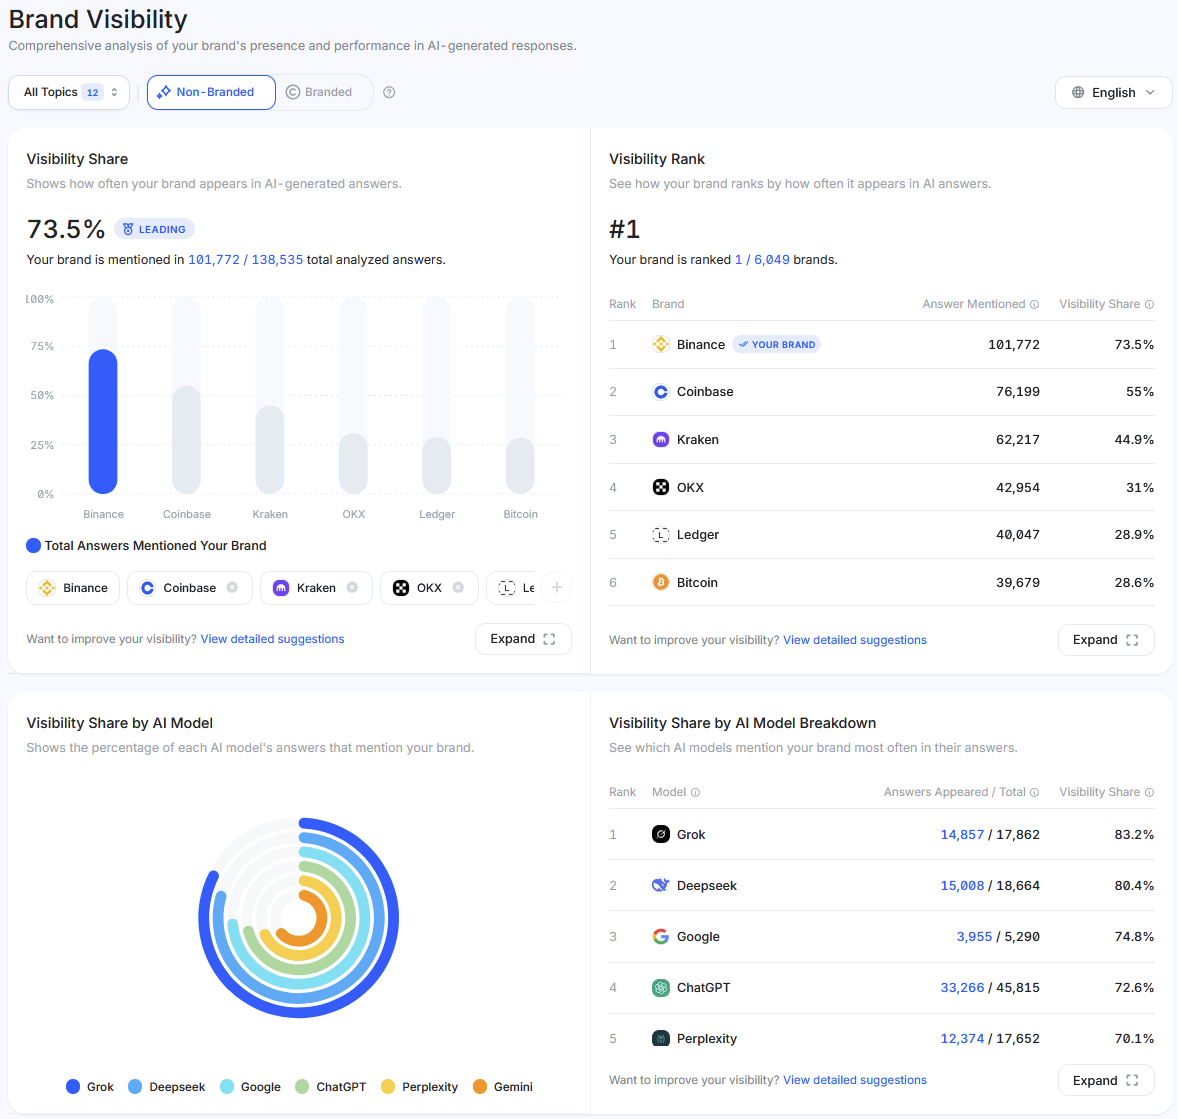
Visibility Share is your overall appearance rate, with the raw answer count behind it. "73.7% LEADING, your brand is mentioned in 103,792 / 140,741 total analyzed answers" means that out of roughly 141,000 AI responses about your industry, Binance showed up in about 104,000. The bar chart stacks you against top competitors so the gap is obvious at a glance.
Visibility Rank puts you in a ranked table. Find the "YOUR BRAND" tag, then read across the Answer Mentioned and Visibility Share columns. Anyone above you is the bar you need to clear. Binance at #1 with 103,792 mentions (73.7%) against #2 with 77,818 (55.3%) puts a number on that lead.
Visibility Share by AI Model breaks it down by platform. The circular chart and table cover Grok, Deepseek, ChatGPT, Google, Gemini, and Perplexity. Watch for percentages over 100%: that means the model names you more than once per response on average. "Grok: 36,395 / 18,018 = 202%" says Grok mentioned the brand about twice per relevant conversation. This is where you spot which platforms love you and which need work.
Understanding share of voice data
Share of Voice measures your cut of total mentions across every tracked conversation. Visibility is how often you appear; share of voice is how much of the talk is about you.
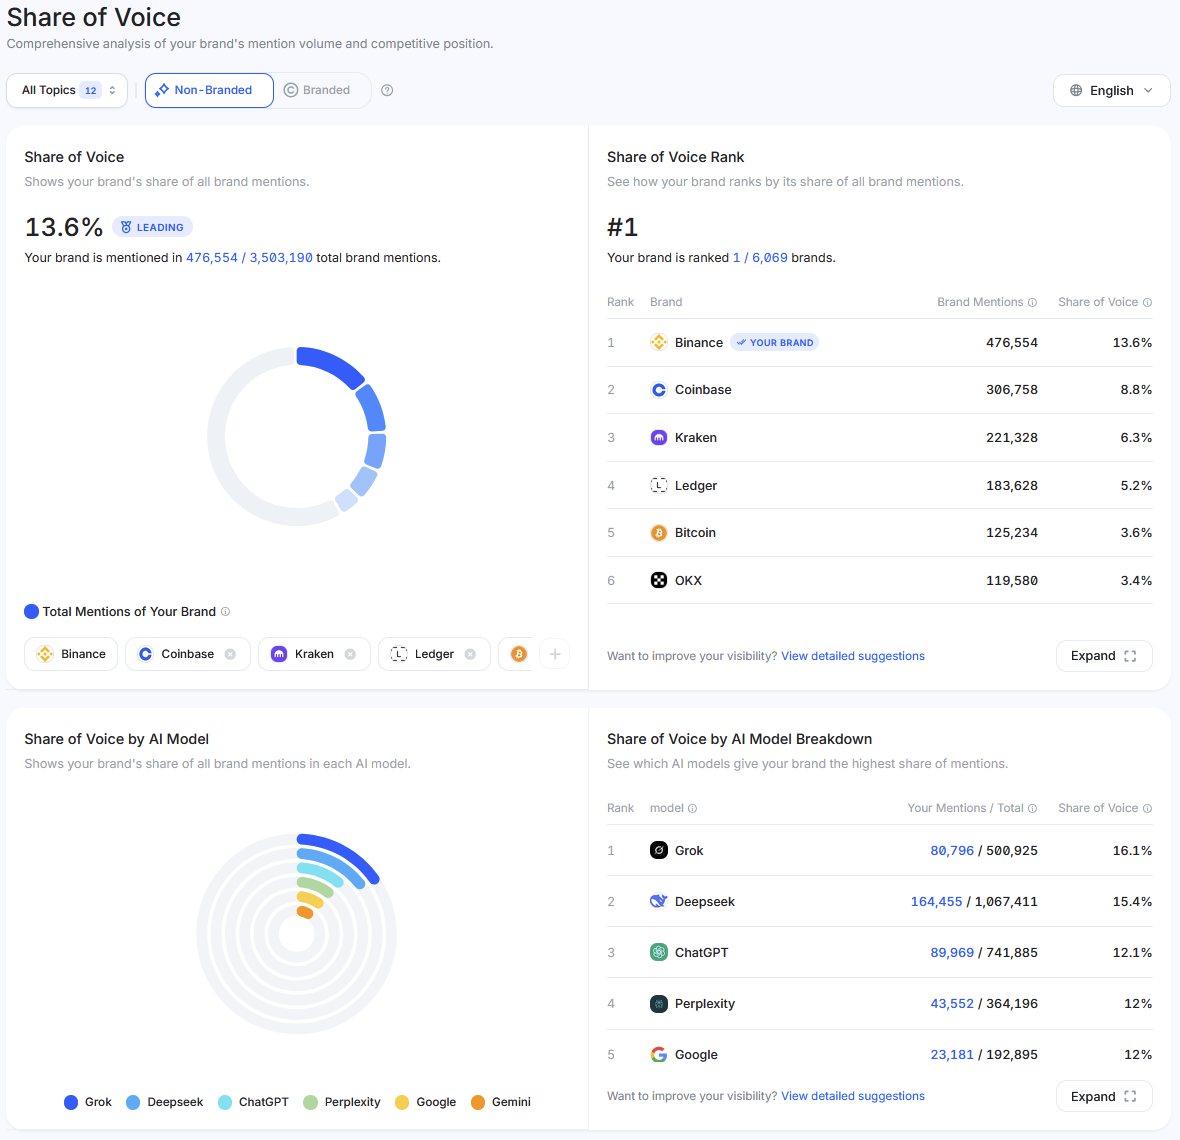
Share of Voice dashboard.
The main metric shows your percentage and mention volume. "12.9% LEADING - Your brand is mentioned in 1,065,116 / 8,270,454 total brand mentions" means that out of 8 million-plus brand mentions across AI conversations, Binance captured about 1 million. The circular chart sets your share against the rest of the market.
Share of Voice Rank is a leaderboard. Find your brand by the "YOUR BRAND" tag and compare Brand Mentions and Share of Voice against rivals. Ranked #1 with 1,065,116 mentions (12.9%) while #2 sits at 703,584 (8.5%) means you're pulling roughly 50% more conversation volume than your nearest competitor.
Share of Voice by AI Model splits it per platform, showing "Your Mentions / Total" for each. "Grok: 186,961 / 1,230,389 = 15.2%" tells you that on Grok, you own 15.2% of all brand mentions. Compare across platforms to see where you're strong and where competitors run the conversation.
Here's the relationship that matters. You can have 70% visibility but only 10% share of voice, meaning you appear everywhere but only in passing. Flip it, 50% visibility with 20% share of voice, and you're discussed at length whenever you do appear. You want both climbing together.
Navigating topic performance analysis
The Topics section breaks visibility down by category, showing where you win and where you get beaten. This is where it gets tactical.
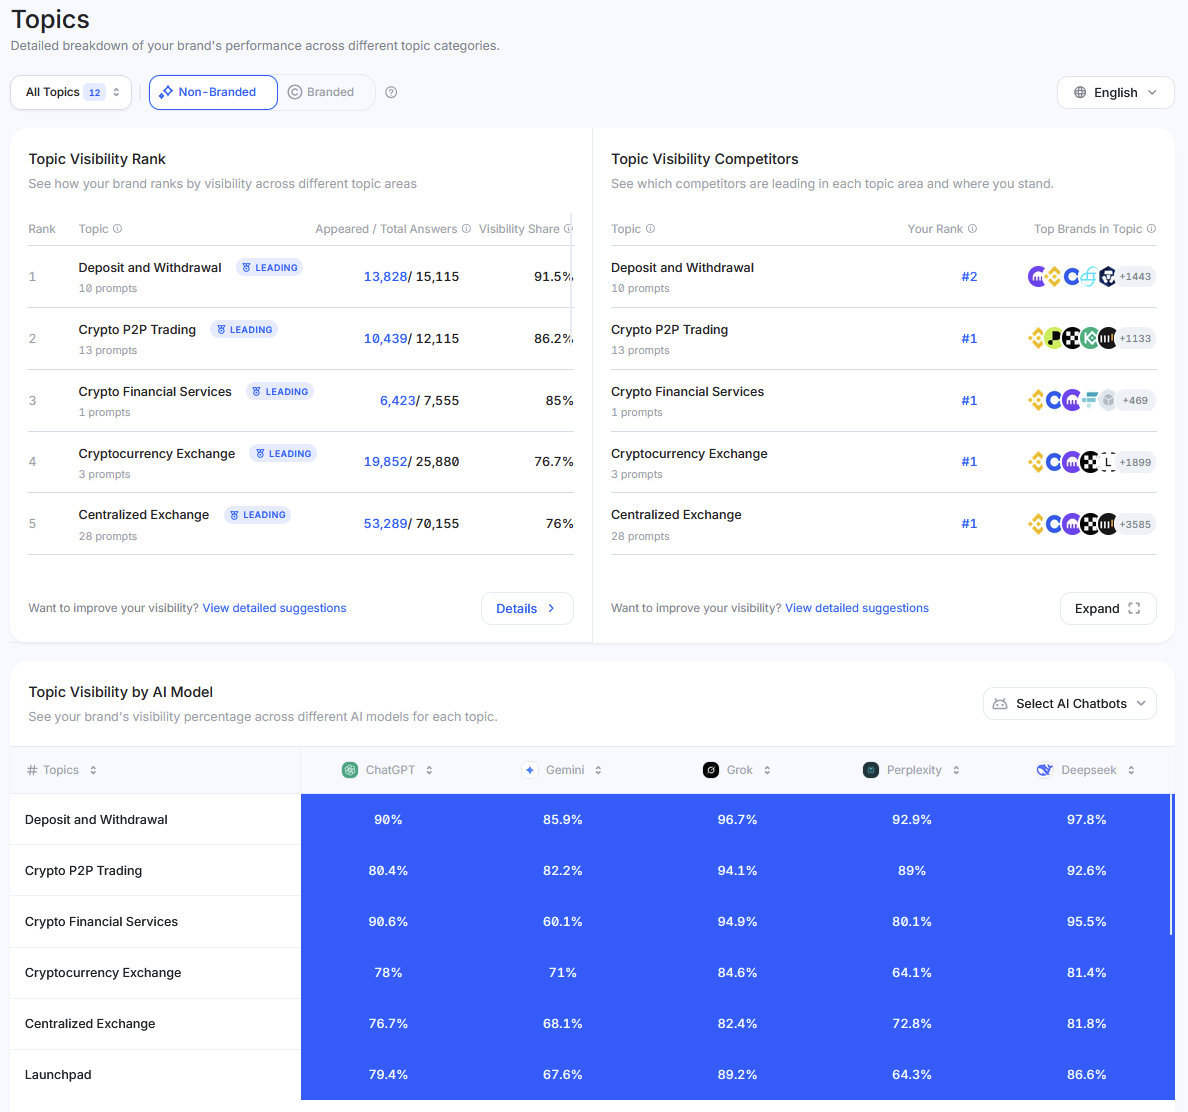
Topics dashboard.
Topic Visibility Rank lists every tracked category with your numbers in each: the topic name and prompt count ("Deposit and Withdrawal - 10 prompts"), a status badge ("LEADING" means top positions), the Appeared / Total Answers count ("13,810 / 15,096"), and your Visibility Share ("91.5%"). Scan for your strongest categories and your weakest. The "LEADING" tags are your advantages.
Topic Visibility Competitors shows who you're up against in each category. Next to a topic you'll see icons for the top brands and a count, like "Deposit and Withdrawal: 10 prompts" followed by competitor icons and "+1439", meaning 1,439 brands compete there. No icon for you among the leaders means you're getting outperformed.
Topic Visibility by AI Model is a heat map of your visibility per topic per platform. You might read Deposit and Withdrawal at ChatGPT 89.8%, Gemini 86.2%, Grok 96.8%, Perplexity 93.1%, Deepseek 97.8%, and Crypto P2P Trading at ChatGPT 80.6%, Gemini 82.7%, Grok 94.2%, Perplexity 89.3%, Deepseek 92.7%. Darker blue is higher. If one platform stays low across topics, it's likely weighing different ranking signals or trusting different sources.
💡Learn more: How to Generate Your Brand Free AI Visibility Report on Mention Network
Reading prompt-level performance data
The Prompts section is where you see the actual questions people ask that mention your brand. It ties your metrics back to intent. Two views: by Topic and by Prompt.
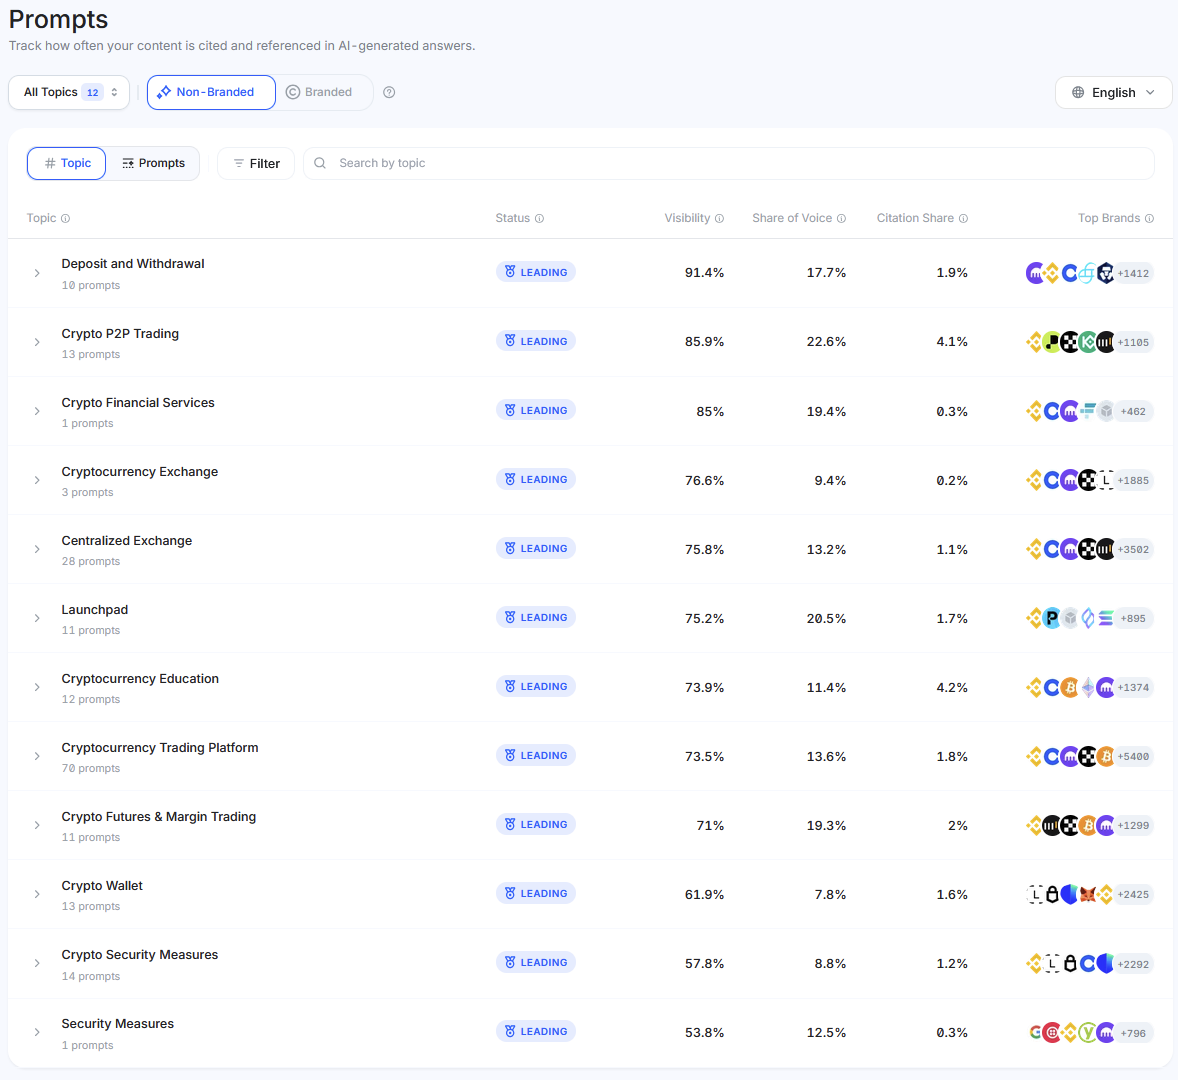
Prompt dashboard.
Topic View groups prompts into categories. Each shows the topic name and prompt count, a status badge (LEADING, STRONG, WEAK), the Visibility, Share of Voice, and Citation Share percentages, and icons for the top brands. "Deposit and Withdrawal - 10 prompts, LEADING, 91.5% visibility, 17.7% share of voice, 1.9% citation share" reads as: 10 questions in this category, Binance leads, appears in 91.5% of responses, and takes 17.7% of mention volume.
Prompt View drops to individual questions. Each row shows the actual question ("Which crypto wallets offer the best integration with trading platforms?"), the mention status ("Mentioned (5,991/6,342)" means you appeared in 5,991 of 6,342 answers), topic tags (#Cryptocurrency Trading Platform, #Crypto Wallet), platform icons with mention counts, and your Visibility and Share of Voice for that question.
Focus on two things. High-volume prompts where you're "Mentioned" are what's driving your visibility. High-volume prompts where you're missing are content gaps, and usually the fastest wins on the list. The platform icons also tell you which AIs field the most questions in an area; heavy ChatGPT and Perplexity counts mean those platforms get the most queries there.
Interpreting citation metrics
Citations measure how often AI models cite your website as a source. That's different from a brand mention. A citation means the model trusted your content enough to point at it.
Citations dashboard.
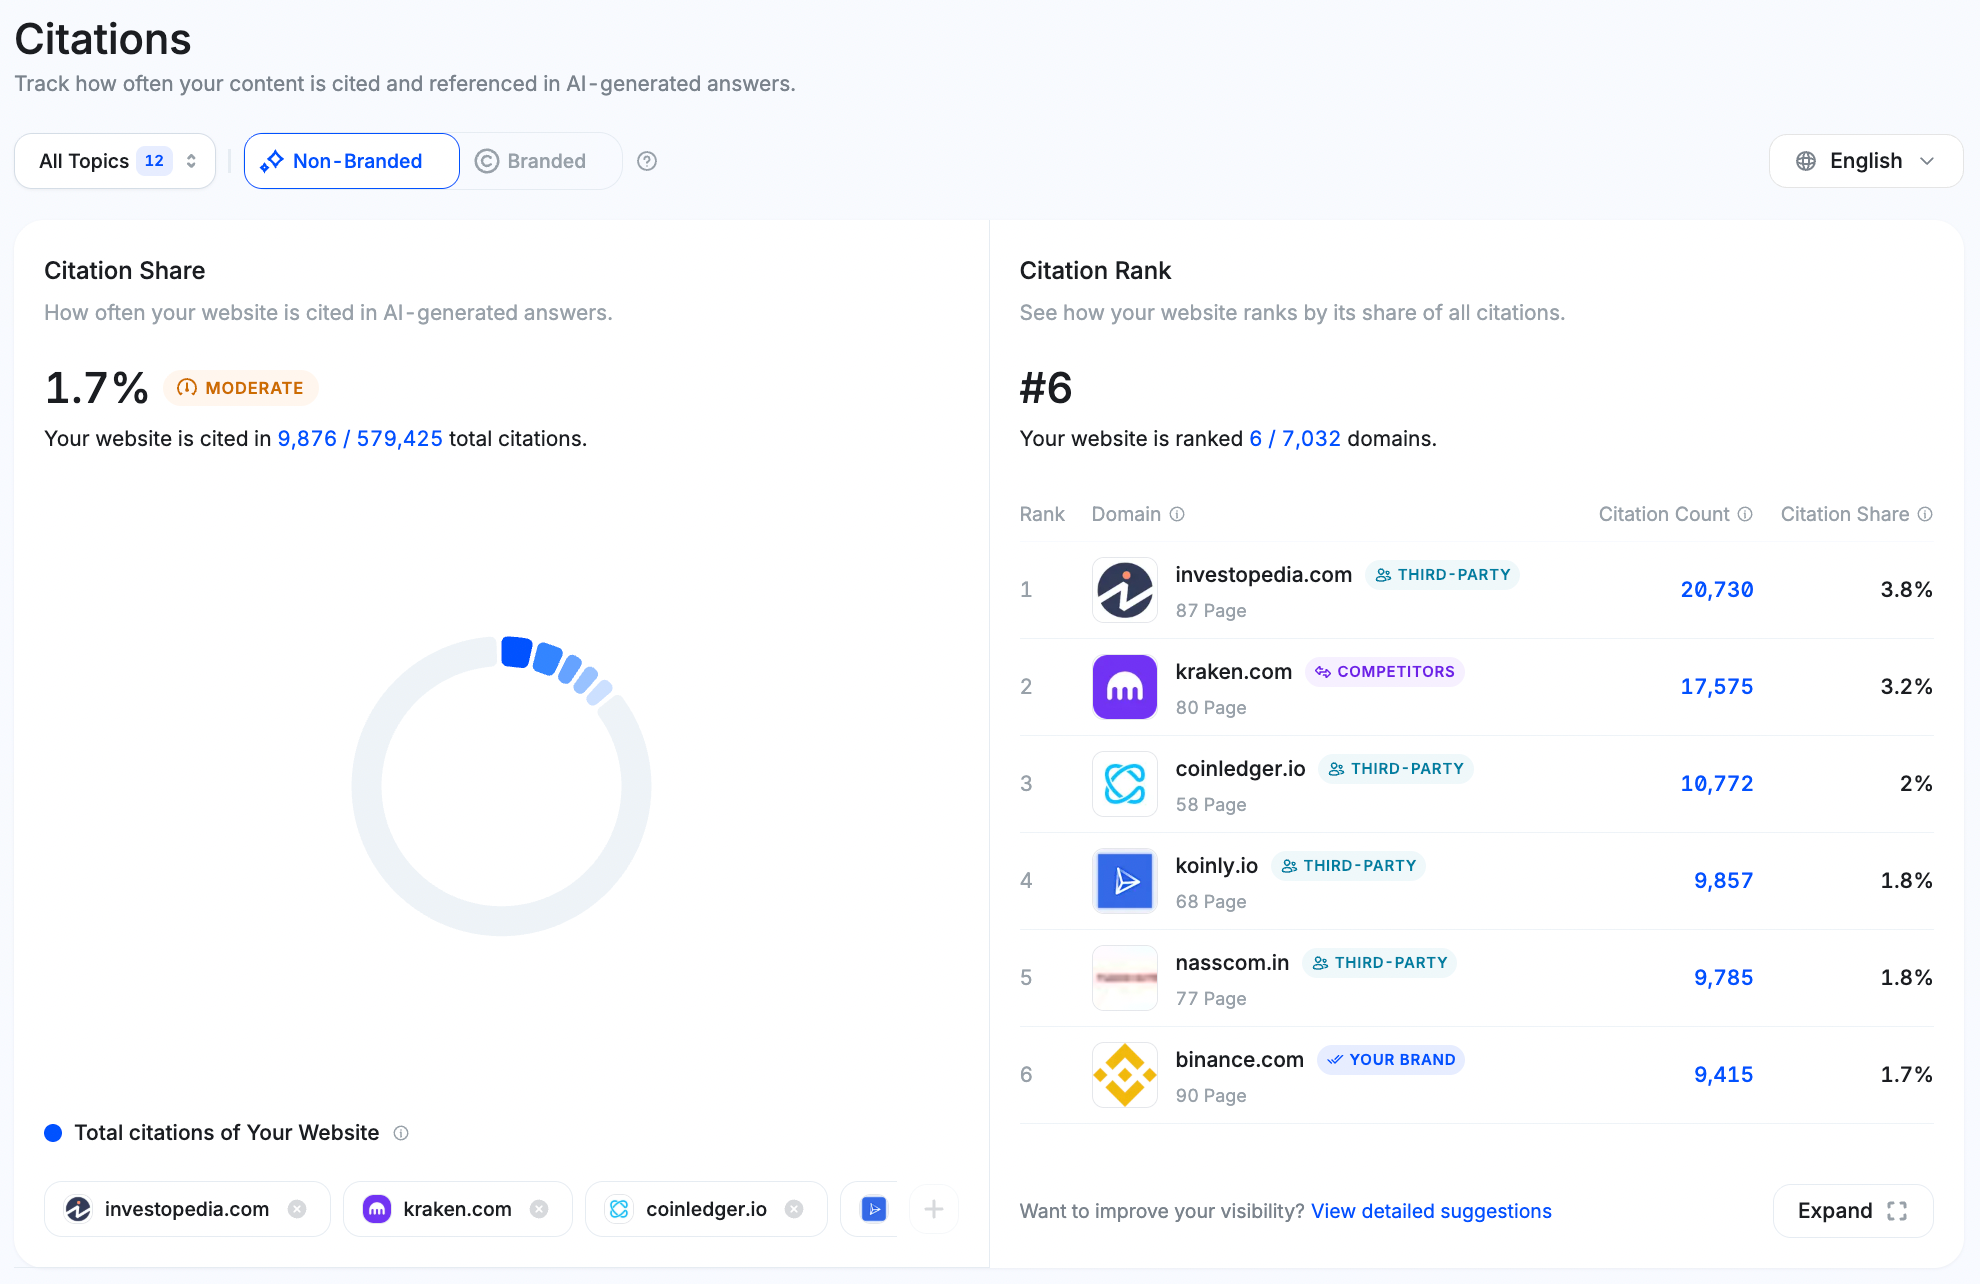
Citation Share is your slice of total citations. "1.7% MODERATE - Your website is cited in 9,876 / 579,425 total citations" means AI cited you about 10,000 times out of 579,000. The "MODERATE" status says you're cited, just not at the top of the field.
Citation Rank stacks you against every competing domain. The table shows the domain with a tag ("YOUR BRAND", "COMPETITORS", or "THIRD-PARTY"), its cited page count, total Citation Count, and Citation Share. Seeing "investopedia.com - THIRD-PARTY - 20,730 - 3.8%" above you means a publisher out-cites your brand, which is normal: AI tends to trust educational content from established publishers.
Citation Sources, Citation by AI Model, Citation by AI Model Breakdown dashboard.
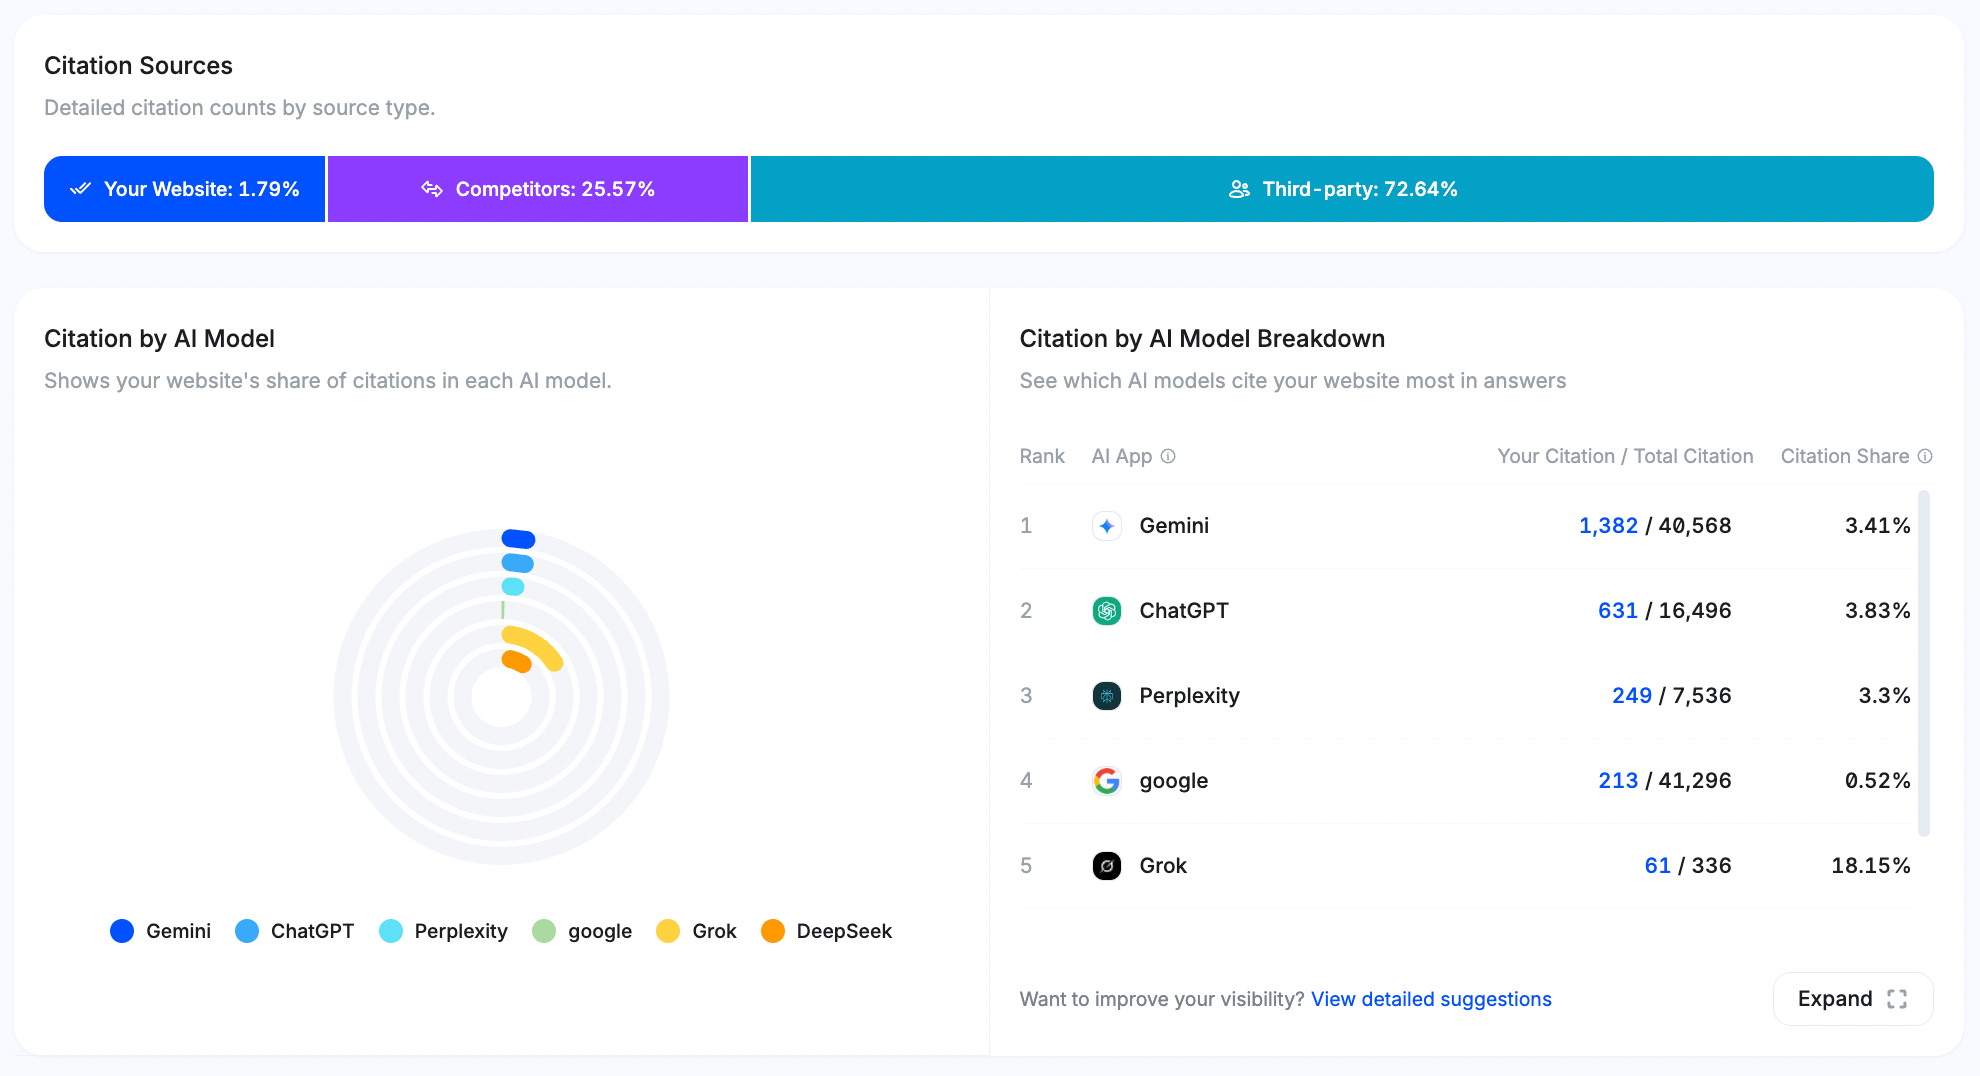
Citation Sources splits where your citations come from: your own website, competitor sites, and third-party sources like news, educational platforms, and aggregators. A split like "Your Website: 1.79%, Competitors: 25.57%, Third-party: 72.84%" is typical, and it points straight at the opportunity to build up your own content authority.
Citation by AI Model shows which platforms cite you most, with readings like Gemini 1,382 / 40,568 = 3.41%, ChatGPT 631 / 16,496 = 3.83%, and Perplexity 249 / 7,536 = 3.3%. Low percentages on a platform mean it prefers different content types or sources.
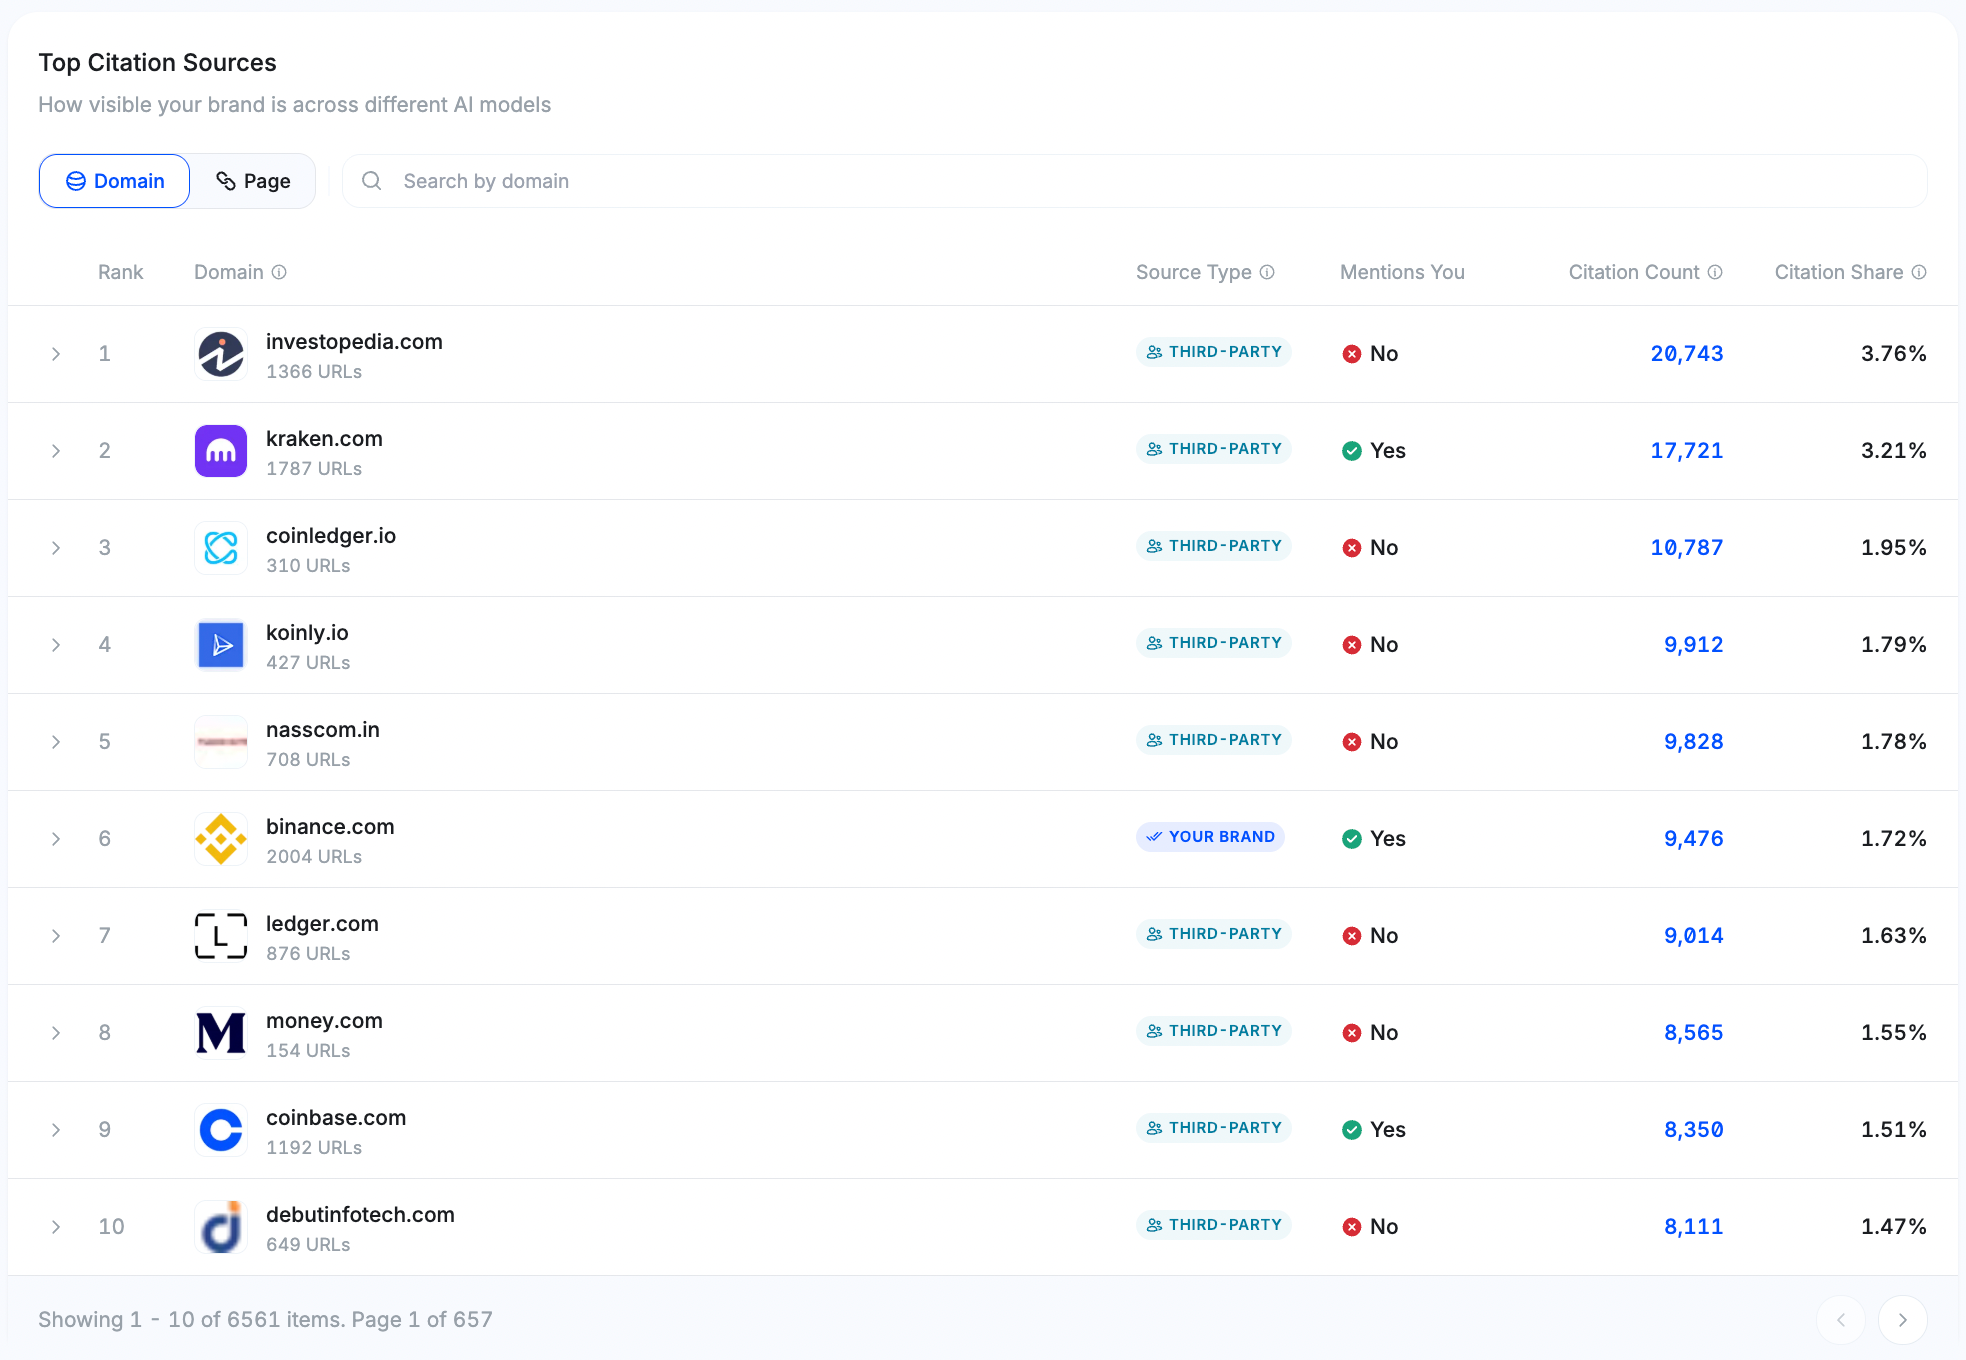
Top Citation Sources lists the domains AI references most when citing anything relevant to your brand.
Top Citation Sources dashboard.
Each row gives the domain, citation type, whether it names your brand, and its share of total citations, so you can see the content ecosystems shaping AI trust. In the example, Investopedia.com leads with 20,743 citations (3.76%), Kraken.com holds 17,721 citations (3.21%) as both a third-party and an active brand, and Binance lands 6th with 9,476 citations (1.72%), tagged "YOUR BRAND". Sitting in the same reference tier as your industry signals solid trust in AI knowledge graphs. More long-form, data-backed educational content is what pushes that share toward the top.
💡Related topic: How to Measure Your Brand's AI Visibility - Key Metrics and Tools
Analyzing geographic distribution data
The Geography section maps where in the world your brand gets mentioned in AI answers, across 132 tracked countries. Good for spotting regional strengths and expansion room.
Geography dashboard.
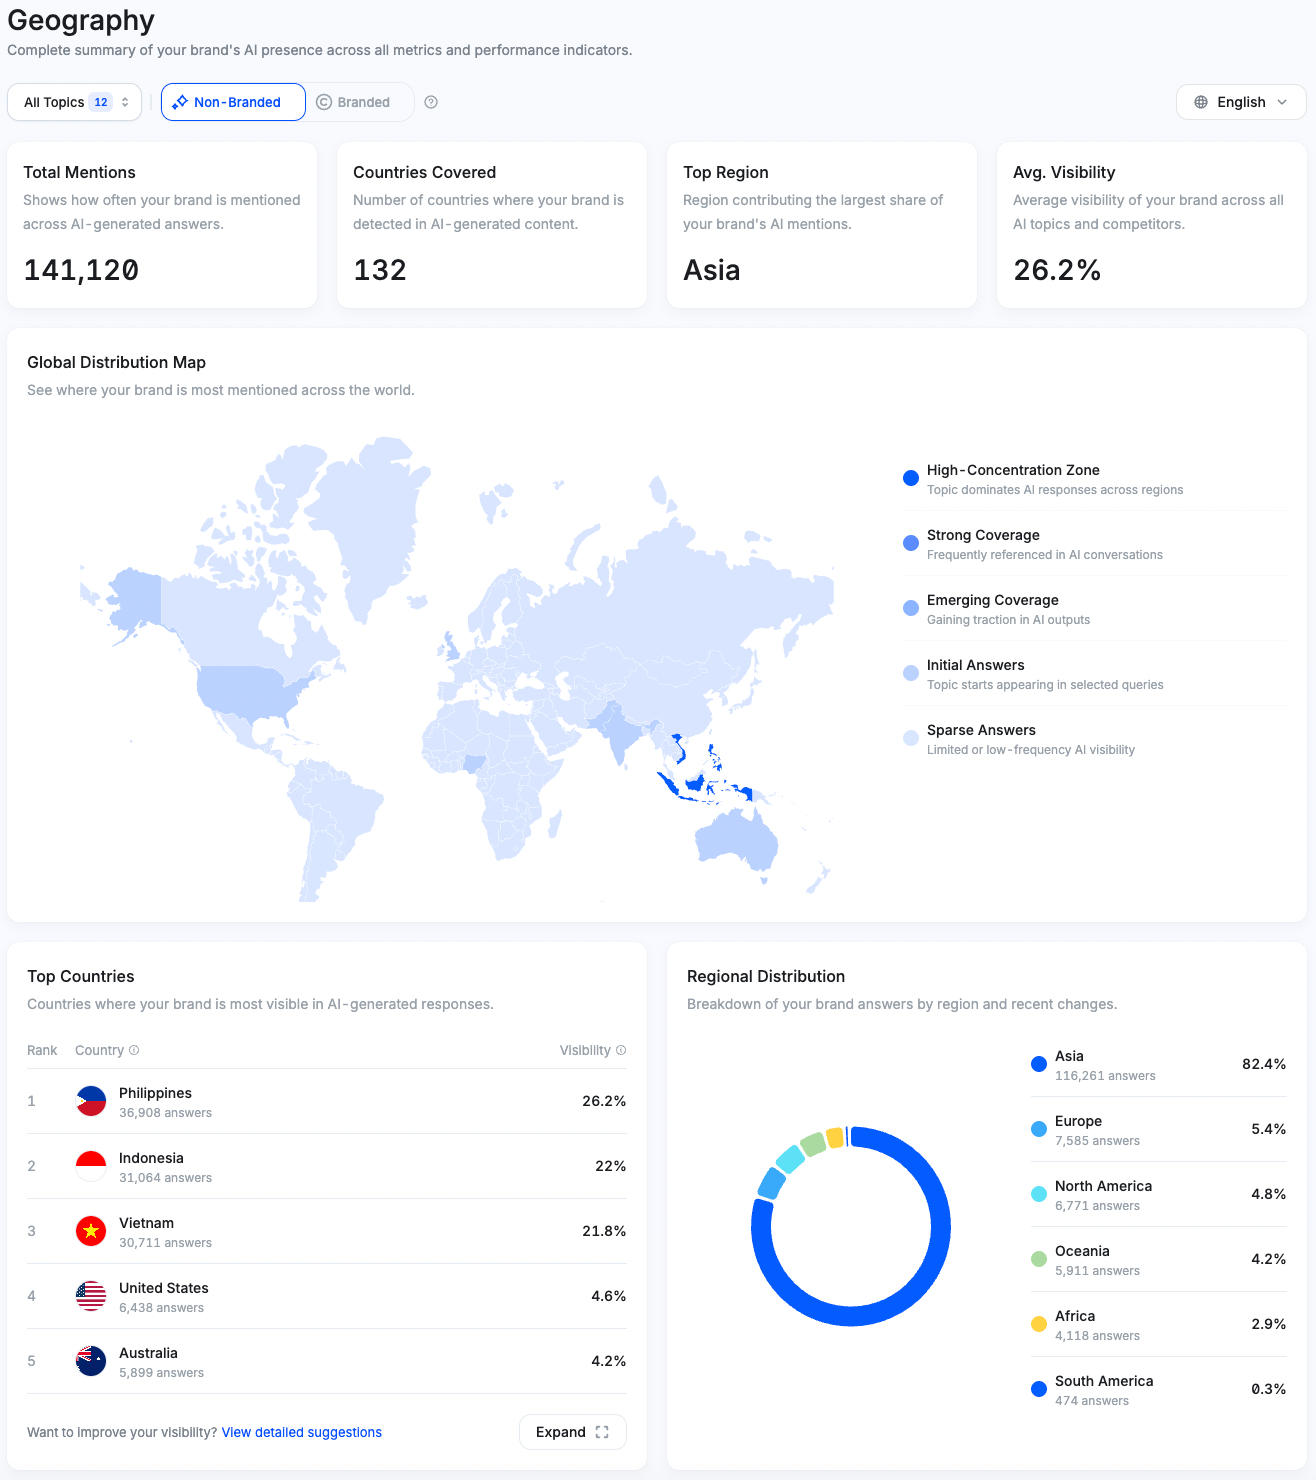
The overview metrics set the global context: Total Mentions (how many times you appeared across all countries, e.g. 140,809), Countries Covered (e.g. 132), Top Region (your strongest area by mention share, e.g. Asia), and Avg. Visibility (your average across topics and regions, e.g. 26.2%).
The Global Distribution Map shades regions by mention concentration, darker blue for higher. Five tiers run from High-Concentration Zone (you dominate AI answers there) through Strong Coverage, Emerging Coverage, and Initial Answers down to Sparse Answers (low or occasional visibility). It's a fast read on where you're strong and where you have room.
Top Countries ranks individual countries by visibility percentage and answer count:
- Philippines: 26.2% visibility, 38,895 answers
- Indonesia: 22% visibility, 31,027 answers
- Vietnam: 21.6% visibility, 30,458 answers
- United States: 4.6% visibility, 6,438 answers
- Australia: 4.2% visibility, 5,899 answers
The percentage is how often you appear within that country; the answer count is its total question volume. High visibility with a low answer count usually means strong regional performance in a smaller market.
Regional Distribution rolls it up by continent:
- Asia: 82.3%, 115,955 answers
- Europe: 5.4%, 7,583 answers
- North America: 4.8%, 6,771 answers
- Oceania: 4.2%, 5,911 answers
- Africa: 2.9%, 4,113 answers
- South America: 0.3%, 474 answers
A split like 82% in Asia against 5% in Europe is either deliberate market focus or a wide-open expansion opportunity, and only you know which.
Putting your report into action
The Mention Network AI Visibility Report shows how your brand performs across AI platforms and where to put your effort. Reading it is step one. Acting on it is the point.
Start with the Overview to see where you stand, then use the detailed sections to find what's driving or capping your visibility. This table maps each area to a next move.
| Focus Area | What It Shows | What To Do Next |
|---|---|---|
| Overview Metrics | Overall visibility, share of voice, and citation share across AI platforms. | Use it as a baseline: do you need more visibility, or more authority? |
| Citations | How often AI models cite your brand as a trusted source. | Strong visibility but weak citations? Check that your factual data and brand information are accurate and consistent everywhere. |
| Topics and Prompts | The themes and questions where your brand shows up. | Find the conversations you're missing from, then create content or adjust messaging to fill the gap. |
| Geographic Data | Mentions by continent, country, and region. | Read it for expansion. Strength in one region can mark a focus; weakness elsewhere can mark an opening. |
| AI Platform Breakdown | How your brand performs on ChatGPT, Gemini, Grok, and Perplexity. | Prioritize the platforms your audience actually uses, and tune your content for those first. |
| Competitor Analysis | Visibility, citations, and sentiment against similar brands. | Study where rivals beat you and where they're thin, then adjust your positioning. |
| SWOT and Priority Recommendations | Combined signal from every section. | Treat it as your roadmap for the next round of GEO and content work. |
The report tells you what's wrong. The rest of the platform helps you fix it. The store audit diagnoses why AI overlooks specific products, drafts the change for the product page, and lets you approve and publish it from your store admin. That's the loop: measure your brand and product visibility, diagnose the cause, ship the fix, and watch the next report move.
Treat this as competitive intelligence, not a dashboard you glance at. The data shows where rivals are winning and how you compare, and checking it on a schedule is how you catch a competitor gaining ground or a new region opening up before the gap gets expensive. Strong in Southeast Asia but weak in North America? Decide whether that's intentional. Winning some topics and absent from others? Go make the content for the ones you're missing.
AI models update their data and their logic constantly, so what ranks well today can move in a few months. Regular check-ins surface those shifts early, like a competitor climbing or an unexpected region taking off. The brands that win here read their data, act on it, and keep tightening based on what the report shows.
Frequently asked questions
How often is the brand report updated? Data is collected continuously across the six AI platforms. Each report reflects near real-time monitoring, and the timestamp (like updated 9/10/2025) marks the latest data compilation.
Why do some AI models exceed 100% visibility? Anything over 100% means multiple mentions per response. 202% on Grok means the model named your brand about twice, on average, in relevant answers.
How do brand visibility and share of voice differ? Visibility is how often your brand appears in AI outputs. Share of voice is your proportion of total mentions. One measures presence, the other measures dominance.
What are "Non-Branded" topics? These are questions with no brand name in them, where the AI recommends options on its own. Doing well here shows your brand is discoverable in neutral, unprompted contexts.
Why is citation share lower than visibility? High visibility with low citation share is awareness without authority. Strengthen your content's accuracy, depth, and external validation to lift the trust signals.
How should I prioritize AI platforms for improvement? Go where your audience is. If ChatGPT and Perplexity drive most of your queries, work those before the lower-traffic models.
Can I view the actual user questions? Yes. The Prompts section lists the actual questions that triggered AI responses in your category, and reading them reveals intent patterns and content openings.
What if competitors outrank my brand? Look at which topics and prompts they own, find the depth or citation quality you're missing, then close it with focused content.
Run your free AI Visibility Report
See how ChatGPT, Gemini, and Google AI describe your brand and products, then get the store audit that tells you what to fix. Generate your free report or walk through it step by step.